Flotier turns unused rooftop edge space into a second energy source — one that runs at night, in winter, and in weather when solar output drops. No land, no mast, no planning application.
Most flat-roofed commercial and industrial buildings are strong candidates. Run through these six criteria — the more you check, the stronger the fit.
Enables straightforward, non-invasive installation.
The sweet spot for rooftop edge wind acceleration.
More edge length means more usable installation positions.
No taller neighbouring structures blocking prevailing wind.
6 m/s is the confirmed minimum operating wind speed; 8 m/s+ is recommended for strong output. Based on local wind resource data for your site.
Allows direct integration of AC output into building supply.
Based on the Flotier 100 datasheet: units mount side by side along the roof edge, and annual output per unit follows the manufacturer's measured performance curve. Pricing isn't shown — no system price is confirmed yet, so a payback figure would be a guess, not an estimate.
Units sized at ~1.5 m of roof edge each (unit width 1,450 mm + clearance). Output per unit uses the confirmed Flotier 100 datasheet curve — your real output also depends on turbulence, orientation, and obstructions. Windees/Flotier's manufacturer price is €7,560 per unit at the distributor level; your final installed price will depend on your local partner's margin and installation cost, so it isn't shown here.
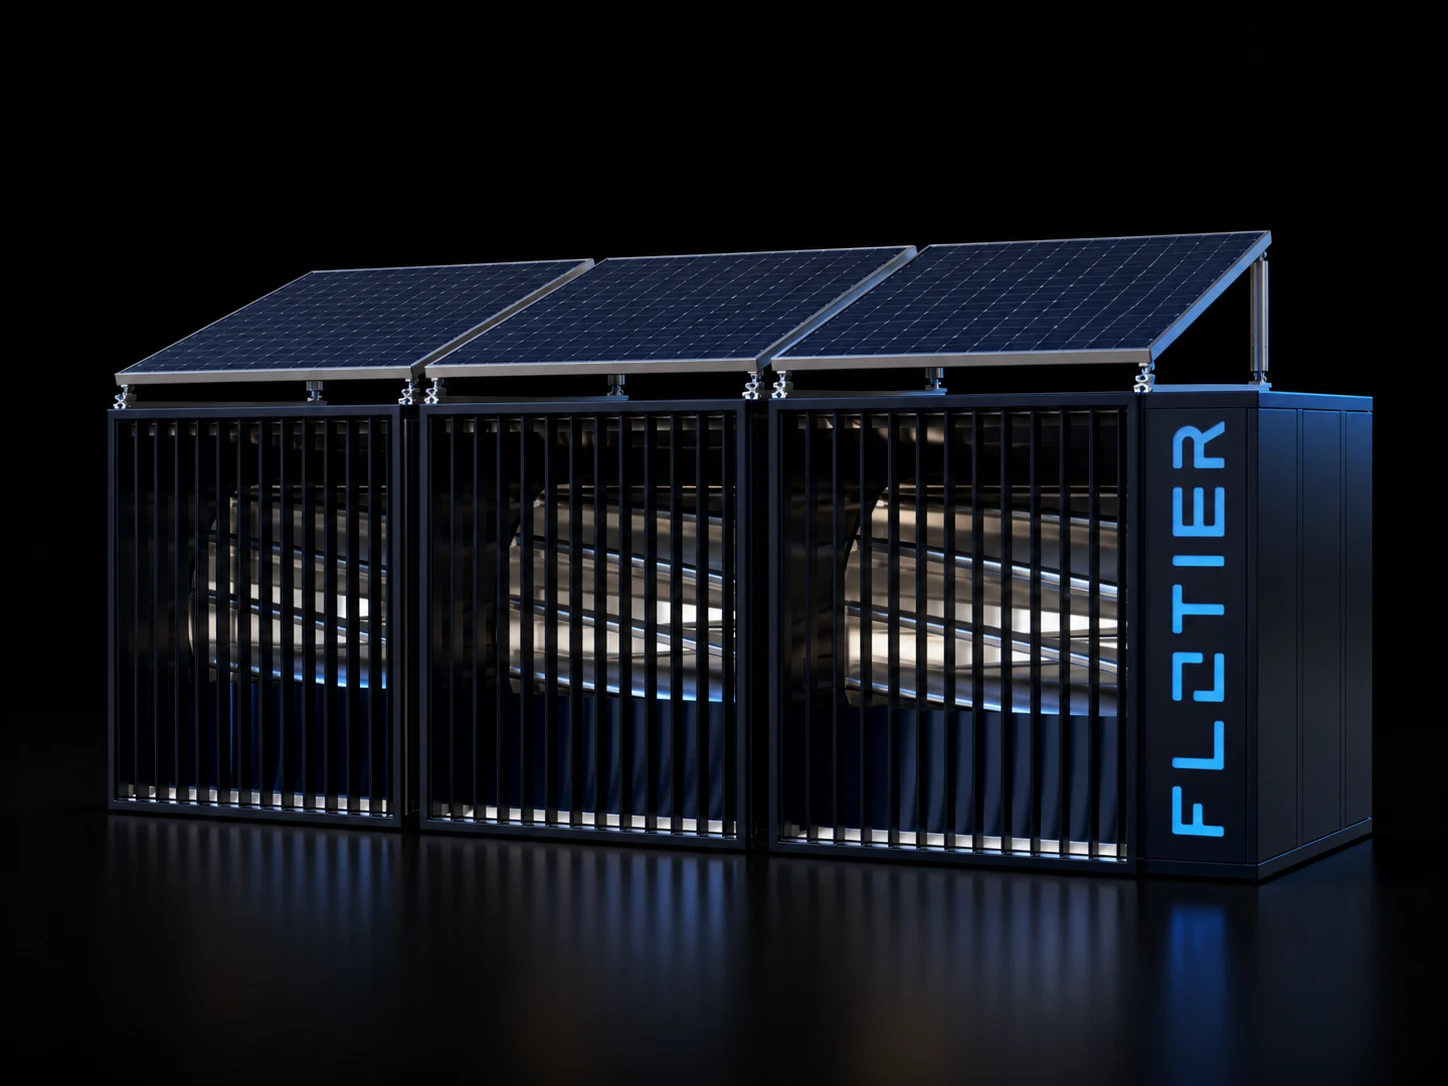
Solar alone typically covers a fraction of a commercial building's demand — and none of it at night or in winter. Adding Flotier extends generation into exactly the hours and seasons solar can't reach. Flotier's housing is also designed to take solar panels mounted directly onto it — a single hybrid unit generating from both sun and wind in one footprint.
Figures illustrative — to be confirmed with pilot or simulation data.
Illustrative hourly output for a 3 m² rooftop turbine at an ideal 10 m height, paired with a 1 m² solar panel, using typical wind and solar conditions for Northern Germany. Pick a month to see how the shape changes.
What this chart is based on: Wind — a simplified physics model (P = ½·Cp·ρ·A·v³, swept area 3 m², power coefficient Cp≈0.35, air density 1.225 kg/m³, cut-in 3 m/s, rated ≈1.1 kW at 12 m/s), driven by typical monthly-average wind speeds at 10 m height for Northern Germany (≈3.9–5.8 m/s depending on season) with an illustrative diurnal profile — modestly windier in the afternoon, calmer overnight. Solar — a 1 m² panel at ~20% module efficiency with ~15% system derating, driven by typical monthly-average daily irradiation for Northern Germany (~53°N), spread across daylight hours using a simplified clear-sky-shaped curve; sunrise/sunset times are approximate for that latitude. All figures are illustrative long-term averages, not live weather data or the confirmed Flotier 100 product datasheet — an individual day can vary substantially, especially for wind.
We review your building(s) against the qualification criteria remotely.
Local wind resource and roof geometry are validated for your specific site.
You receive a site-specific proposal with unit count, output, and payback estimate.
A certified partner installs your system — similar in process to a solar PV install.
Please click below to send your details by email instead:
Open email to send →This routes to the building-owner assessment path — separate from the general contact form.